Field Service Reporting Software and Dashboards
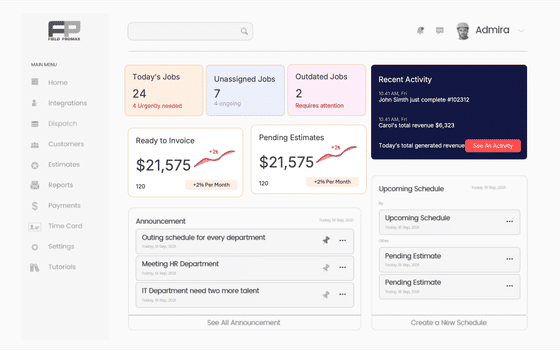
Know where the business stands before the first phone call.
Field Promax gives each user a live dashboard of today's work orders, unassigned jobs, collections and visits, plus more than 30 standard reports across work orders, timecards, job costing, estimates, payments and lead sources. Filter any report by date, status or technician, open it as a chart, and export reports like work orders and payments to Excel. Need something we don't have? Our team can build a custom report for your company.
Trusted by 100,000+ contractors. Rated 4.7 on Google and 4.2 on Capterra.
Real-Time Financial Insights
The last thing you want is to make decisions based on outdated information.
Field Promax’s comprehensive dashboard provides real-time financial reporting tools for effective operations management.
Request Demo

Custom Financial Reports
Generic reports often miss crucial business-specific data.
Our pro reporting feature allows for tailor-made financial reporting tools that align perfectly with your unique tracking needs.
Request DemoComprehensive Analytics Suite
Our reporting system includes these powerful analytical tools:
Financial Performance
Track revenue, profit margins, average ticket value, and other financial metrics by service type, technician, or geographical area.
Operational Efficiency
Measure response times, job duration, travel time, and other operational metrics to identify bottlenecks and optimization opportunities.
Customer Analytics
Analyze customer acquisition, retention, lifetime value, and service frequency to inform marketing and retention strategies.
Technician Performance
Compare productivity, efficiency, revenue generation, and customer satisfaction scores across your team to recognize and reward top performers.
Service Trends
Identify seasonal patterns, emerging service needs, and changing customer preferences to adapt your service offerings and resource planning.
Field Activity Map
Review check-ins, check-outs and job completions on a map, each placed at the GPS location where it was recorded.
Frequently Asked Questions
It turns the work your team already logs (work orders, visits, timecards, estimates and payments) into reports and charts, so you can see what got done, who did it and what was collected without building spreadsheets. In Field Promax, the dashboard shows today's numbers at a glance and the Reports page holds more than 30 standard reports you can filter, chart and export.
More than 30 standard reports in 7 groups: Work Orders (summary, details, closed out, pending approval, recurring, scheduled vs. actual time, daily route list), Timecards (clock in/out, PTO hours, time logged per work order), Job Costing, Estimates, Payments, Reference Lists (customers, new customers, equipment, products, users) and Supplementary (expenses, mileage, custom tracking). There are also reports for lead source, response time and travel time. Star the ones you use most to pin them to the top.
Six live work order tiles (Today's, Unassigned, Recurrence, Outdated, All Open and Completed) with revenue under open and completed jobs. Click any tile to open that filtered list. Widgets also cover payments this month vs. last month by payment type, completed vs. pending visits, approved vs. pending estimates, closed order revenue over 12 or 24 months, service requests, days off and user activity.
Yes. Click Edit Layout to drag, resize, add or remove widgets. The layout saves to your login, so each user has their own board and it follows them to any computer. You can also pick what opens after login: the Dashboard, Open Work Orders, the Calendar, or Calendar and Map.
Yes. If the standard reports don't cover what you track, our team can build a report for your company. It shows up under the Custom tab on the Reports page and runs like any other report, with its own filters. Ask during your demo or email info@fieldpromax.com.
Yes. Filter the Work Order Summary by service provider, compare scheduled vs. actual time worked, check billable vs. non-billable hours, and review clock in/out, time logged per work order and mileage by technician. For profit per technician, see profit analysis.
The dashboard's Service Provider Status widget shows activity for each technician, grouped by work group, and the User Activity widget lists recent actions across your users. To see jobs on a map, use the Calendar and Map view. For technician locations, see GPS tracking.
Yes. One click on Export to Excel downloads exactly what the report grid shows, with your filters and search applied. That makes it easy to share numbers with your accountant, and you can use the time reports when you run payroll. Each report can also be opened as a chart, such as work orders by job type or revenue over time.
You can run Revenue Analysis by Customer to see who brings in the most work, a New Customers List for any date range, a full Customer List, and Equipment List with Work Order Details to see service history by unit. Each one can be filtered and exported to Excel. There are also reports on customer lifetime value, retention and satisfaction scores.
There is no free plan, but you can try Field Promax free for 14 days after a short demo. Plans start at $99/month in the US and A$149/month in Australia. See plans and pricing.